
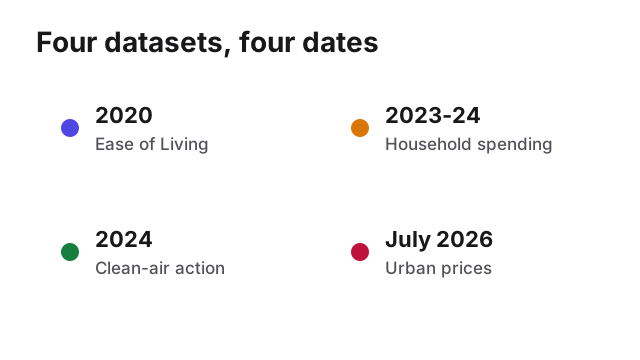
India does not publish one current city score for quality of life and cost of living. The best national city ranking comes from 2020. The household spending survey covers 2023-24. The latest price data runs to July 2026. Each source answers a different question.
 Tap to enlarge
Sources are the MoHUA Ease of Living report, the MoSPI Household Consumption Expenditure Survey, the MoSPI July 2026 CPI release and CPCB air-programme results.
Start with the dates
The Ease of Living dashboard from the Ministry of Housing and Urban Affairs covers 111 cities. It uses 49 indicators in 14 categories: education, health, housing, water and sanitation, mobility, safety, recreation, economic opportunity, environment and resilience.
The final score gives 35% to Quality of Life, 15% to Economic Ability, 20% to Sustainability and 30% to the Citizen Perception Survey. The survey gathered more than 32 lakh responses in February and March 2020. The score therefore predates the pandemic and the last six years of urban change.
The newer sources are useful, but they do not replace the missing 2026 city ranking. MoSPI measures household spending at state level. MoSPI also measures inflation for urban India as a whole. CPCB measures air action and station-level air quality. None provides a current rent index for every city.
 Tap to enlarge
The official ranking
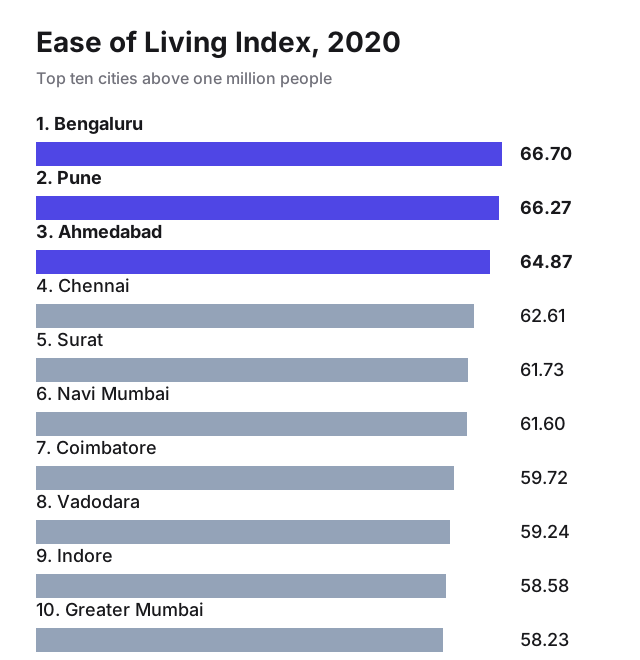
The MoHUA report gives Bengaluru 66.70, Pune 66.27 and Ahmedabad 64.87. Chennai, Surat and Navi Mumbai follow. Six cities sit within five points of each other on a 100-point scale.
Greater Mumbai ranks tenth at 58.23. Delhi ranks thirteenth at 57.56. Hyderabad ranks twenty-fourth at 55.40. The order follows the framework, city submissions, public data and citizen answers. It is not a direct vote for the city where people would prefer to live.
 Tap to enlarge
The list above includes only Million+ cities. Shimla leads the separate Less than Million group at 60.90, followed by Bhubaneswar at 59.85.
The report also notes that some inputs use district or state data when city-level data is unavailable. A city score can therefore describe a wider administrative area.
The pillars change the answer
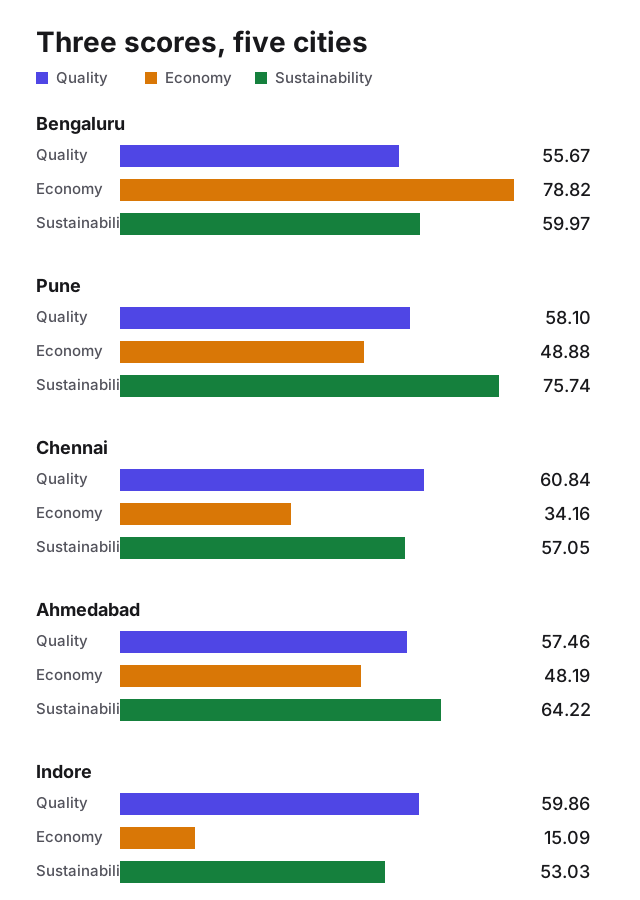
Bengaluru tops the overall Million+ ranking because its Economic Ability score is 78.82. Its Quality of Life score is 55.67. Chennai, Coimbatore, Indore, Pune and Surat all score higher on quality.
Pune has the highest Sustainability score in the selected group at 75.74. Chennai has the highest Quality of Life score at 60.84 and the highest Citizen Perception score at 82.60. The leading city changes with the measure.
 Tap to enlarge
- Bengaluru leads economic ability.
- Pune leads sustainability.
- Chennai leads quality and citizen perception.
- Indore scores high on quality but low on economic ability.
- Mumbai and Delhi sit below the leaders on quality despite large job markets.
The top city depends on the weight you place on work, services, air, housing and time.
What the quality score covers
The MoHUA report divides Quality of Life into education, health, housing and shelter, water and waste services, mobility, safety and recreation. The national average was 51.38. Safety scored 86.7 on average. Housing and shelter scored 79.5. Education scored 70.7. Recreation scored lowest.
Only 36.9% of participating cities had more than 90% of households with piped water. Many cities also had weak sewerage coverage. A score can look acceptable while a resident still faces long travel, high rent or unreliable services.
Newer sources update parts of the picture:
- The National Health Mission publishes health programme data to December 2025.
- UDISE+ publishes school data for 2024-25.
- The NCRB Crime in India 2023 catalogue includes city crime tables.
- The Smart Cities open data portal publishes city datasets for transport, health and civic services.
They do not add up to a current national city score.
Cost of living needs a proxy
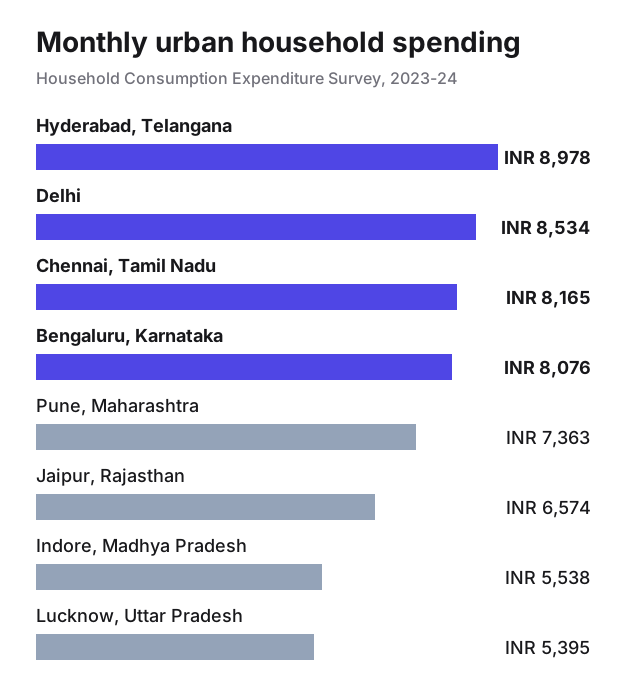
India does not publish a current official table of rent, food, transport, utilities and salaries for every city. The closest consistent measure is Monthly Per Capita Consumption Expenditure, or MPCE, from the Household Consumption Expenditure Survey 2023-24. Average urban MPCE was ₹6,996.
The chart maps each selected city to its state or UT average. High spending can reflect high prices, high incomes or both. It is not a rent index.
 Tap to enlarge
Urban MPCE was ₹8,978 in Telangana, ₹8,534 in Delhi, ₹8,165 in Tamil Nadu, ₹8,076 in Karnataka and ₹7,363 in Maharashtra. It was ₹5,538 in Madhya Pradesh and ₹5,395 in Uttar Pradesh. The differences help compare household spending, but they do not price an apartment in Hyderabad or Bengaluru.
 Tap to enlarge
The top-left quadrant contains Indore, Bhopal, Ahmedabad, Surat and Vadodara. Their quality scores sit above the sample median while their state spending proxies sit below it. Chennai and Coimbatore sit in the top-right quadrant. Cities in the same state share an x-position because MPCE is not published by city.
MoSPI’s July 2026 CPI release gives the current price trend. Urban CPI inflation was 3.96% year on year in July. Urban housing inflation was 2.01%.
 Tap to enlarge
General urban inflation rose from 2.75% in January to 3.96% in July. Housing inflation stayed near 2%. The housing index measures price change, not the rent level in each city.
Air needs a separate chart
CPCB publishes four useful air sources:
- National Ambient Air Quality Monitoring Programme monitoring data.
- National Air Quality Index station and city readings.
- PRANA National Clean Air Programme tracking across 130 cities.
- Swachh Vayu Survekshan 2024 city action results.
Surat, Jabalpur and Agra lead the Million+ category in the 2024 clean-air action assessment. That result measures assessed action and PM10 improvement. It is not an annual PM2.5 exposure ranking.
 Tap to enlarge
Why there is no new combined rank
A combined 2026 rank would require current, city-level measures that do not exist in one government release. The available sources use different dates and geographies.
Keep the measures separate. The 2020 score is the common city baseline. MPCE is a state-level spending measure. CPI is a current urban price-change measure. The air chart is a programme result. None is a rent quote.
What the main cities show
Bengaluru
Bengaluru leads the overall index because its economic score is far ahead of the field. Its quality score is lower than Chennai, Pune, Indore and several other cities.
Pune
Pune ranks second overall and first on sustainability in the selected group. Its quality and economic scores are also above average.
Chennai
Chennai leads Quality of Life at 60.84 and Citizen Perception at 82.60. Urban Tamil Nadu MPCE is ₹8,165, above the all-India urban average.
Ahmedabad and Surat
Ahmedabad ranks third overall. Surat ranks fifth and leads the 2024 clean-air action assessment for Million+ cities.
Indore
Indore ranks ninth overall and scores 59.86 on Quality of Life. Urban Madhya Pradesh MPCE is ₹5,538, below the national urban average.
Mumbai and Delhi
Greater Mumbai ranks tenth overall at 58.23. Delhi ranks thirteenth at 57.56. Both score near the middle on Quality of Life despite large labour markets.
Hyderabad
Hyderabad ranks twenty-fourth overall at 55.40. Telangana has the highest urban MPCE in the selected group at ₹8,978.
What a better release would include
A current city scorecard needs one geography and one release schedule. It should publish:
- City boundaries and the district or metropolitan area used for each measure.
- A quality-of-life score with the year of every input.
- Median rent by dwelling size and distance from public transport.
- Food, fuel, electricity, water, education and health spending.
- Travel time and transit access by ward.
- Annual PM2.5 and PM10 exposure with station coverage.
- Health, school and crime data with population denominators.
- Income and employment data beside spending data.
MoHUA, MoSPI, CPCB, NCRB, the National Health Mission and the Ministry of Education already publish pieces of this system. They do not yet publish them as one current city scorecard.
The ranking
The official answers are:
- Overall Million+ score: Bengaluru, 66.70.
- Quality of Life: Chennai, 60.84.
- Sustainability: Pune, 75.74.
- Economic Ability: Bengaluru, 78.82.
- Citizen Perception: Chennai, 82.60.
- Less than Million group: Shimla, 60.90.
- 2024 clean-air action: Surat.
Bengaluru leads the old overall index. Chennai leads quality and citizen perception. Pune leads sustainability. Surat leads clean-air action. Indore combines a high quality score with lower state-level urban spending. Hyderabad shows why a high spending level should not be read as affordability.
The next national Ease of Living release should be read beside current CPI, household spending and CPCB station data. Until then, ask which city performs well on the measure that matters to you, and how recent that measure is.