
Five million papers. That is the size of this AI research corpus in OpenAlex through mid-2026, and 58.8% of it was published from 2023 through June 2026. That window is three and a half years, not four. In 2025, 944,530 papers matched the query, a 42.6% rise over 2024 and a 10.1x increase since 2013. January through June 2026 logged 812,972. Doubling that half-year gives about 1.6 million. Academic publishing is seasonal. 1.6 million is arithmetic, not a forecast.
Neural networks still dominate (1,522,612 abstracts, or 30.4% of the corpus). Large language models grew 29.9x from 2018 to 2025, and every one of the ten fastest-rising keywords is LLM-related. China's cumulative count is 21.6% above the US. In 2025 the annual gap was 53.4%. Nearly half of all papers (48.9%) have zero citations.
I. Methodology (5 Million Papers, One Open API)
The corpus is 5,003,783 works published between 2013 and mid-2026, pulled from OpenAlex on 12 June 2026. OpenAlex is a living index. Re-running the same strings later will not match digit-for-digit. The counts below are API totals for that pull, documented in the SSRN paper.
The corpus is an abstract-level OR search on ten terms: artificial intelligence, machine learning, deep learning, neural network, language model, reinforcement learning, computer vision, natural language, generative, autonomous. A paper lands in the corpus if any of those strings appear in the abstract. That is a methods-mention census, not a roster of papers whose main contribution is AI. Abstract search returns 1.5x to 7.7x more hits per keyword than title search in this pull. Those ratios are in the paper.
The resulting corpus is 65.4% journal articles, 13.4% preprints, and 7.7% book chapters. Repositories (primarily arXiv) account for 27.4% of sources. Analyses are OpenAlex count queries. No full texts were downloaded.
Publication Volume & Milestone Timeline (2013-2026)
Annual publication volume and key milestonesMilestone
DeepSeek disrupts. 944,530 papers. LLM abstracts are 10.3% of this year (96,984).
II. Keyword counts
The n-gram frequency analysis across 5,003,783 paper abstracts reveals the actual priorities of the global AI research enterprise. Not what conference keynotes claim matters, but what researchers are building.
Linguistic N-Gram Corpus Frequency Analyzer
Most frequent bigrams, trigrams, and rising termsThe bigram distribution splits cleanly into two tiers. The top six terms are method-level. These are neural network, machine learning, deep learning, artificial intelligence, attention mechanism, and large language, totaling 5.37 million abstract mentions. The bottom four are application-level. These are image classification, recommendation system, medical imaging, and feature extraction, totaling 1.39 million. The ratio is 3.9 to 1. Method vocabulary dominates application vocabulary by nearly four to one.
"Neural network" (1,522,612 abstracts, 30.4% of the corpus) remains the foundation term. That is papers whose abstract contains the bigram, not 1.52 million unique architectures. The trend line is more useful than the cumulative stack. In 2025, "deep learning" surpassed "neural network" in annual abstract mentions for the first time (216,713 vs. 207,140), even as neural network retains the larger cumulative total.
"Attention mechanism" (432,079) at rank 5 confirms the transformer's structural dominance across NLP, computer vision, and multimodal tasks since 2017. "Large language" (405,166) at rank 6 has already surpassed application-oriented terms like image classification and recommendation systems, a crossover that occurred within the last two years.
Trigram Architecture
The trigram distribution reveals the architectural building blocks of modern AI. "Deep neural network" (518,431) leads, followed by "convolutional neural network" (394,934). Together they account for over 913,000 abstract mentions.
The critical signal is that "large language model" (292,873) has overtaken both "artificial neural network" (261,355) and "support vector machine" (239,347) to claim the #3 position. LLMs are discussed far more broadly than title-only searches suggest. There are 292,873 abstract mentions versus just 71,469 title mentions, a 4.1x ratio. Five of the ten trigrams end in "network" (deep neural, convolutional neural, artificial neural, recurrent neural, graph neural), reflecting how many research areas have developed their own neural network variant.
III. The LLM Inflection
The LLM trajectory represents the sharpest inflection in the entire five-million-paper corpus. No other term matches this acceleration profile.
"Large language model" abstract mentions grew from 3,248 in 2018 to 96,984 in 2025, a 29.9x increase. The growth curve has a clear inflection point. Between 2018 and 2022, mentions grew at a modest pace (3,248 to 7,931, or 2.4x over four years). Between 2022 and 2025, they grew 12.2x in three years. By 2025, abstracts mentioning "large language model" accounted for 10.3% of that year's corpus papers (96,984 / 944,530), up from 1.9% in 2022. A naive annualization of the 2026 run-rate points at ~170,000. Same caveat as the headline 1.6 million: H2 is not a copy of H1.
For comparison, from 2022 to 2025 "transformer" grew 3.3x, "reinforcement learning" 2.7x, "deep learning" 2.1x, and "neural network" 1.5x. Nothing else comes close to the LLM growth rate.
The Fastest-Rising Keywords
Fastest-Rising Keywords (2025-2026 vs 2022-2023)
Growth velocity of AI research keywordsThe ten fastest-rising keywords tell a definitive story about where research attention is shifting, and every single one is related to large language models. Not computer vision. Not reinforcement learning. Not graph methods. All LLM.
The data groups into three strategic categories.
-
Named models as research subjects. "DeepSeek" (848.7x), "Mistral" (16.8x), and "Gemini" (13.6x) are product names, not architectures. DeepSeek's multiple is a small-baseline explosion: 13 abstracts in 2022-2023, then 11,033 in 2025-2026. The ratio is real, not an 848x increase in model quality.
-
The RAG pipeline. "Retrieval augmented generation" (52.4x), "retrieval-augmented" (19.2x), and "RAG" (15.4x) collectively account for 58,494 papers in 2025-2026, making RAG the single largest growth area by absolute volume after "LLM" itself. The enterprise has chosen its architecture. separate the reasoning engine from the knowledge store.
-
Safety and reliability. "Jailbreak" (25.5x) and "guardrail" (9.7x) track the growing research investment in making language models safe and reliable. This is no longer a niche concern. It is a research category with thousands of papers.
- Bibliometric Signal, Table 4, State of AI Research 2026"All ten of the fastest-rising keywords are related to large language models. None involve computer vision, reinforcement learning, or graph methods."
Method Lifecycles
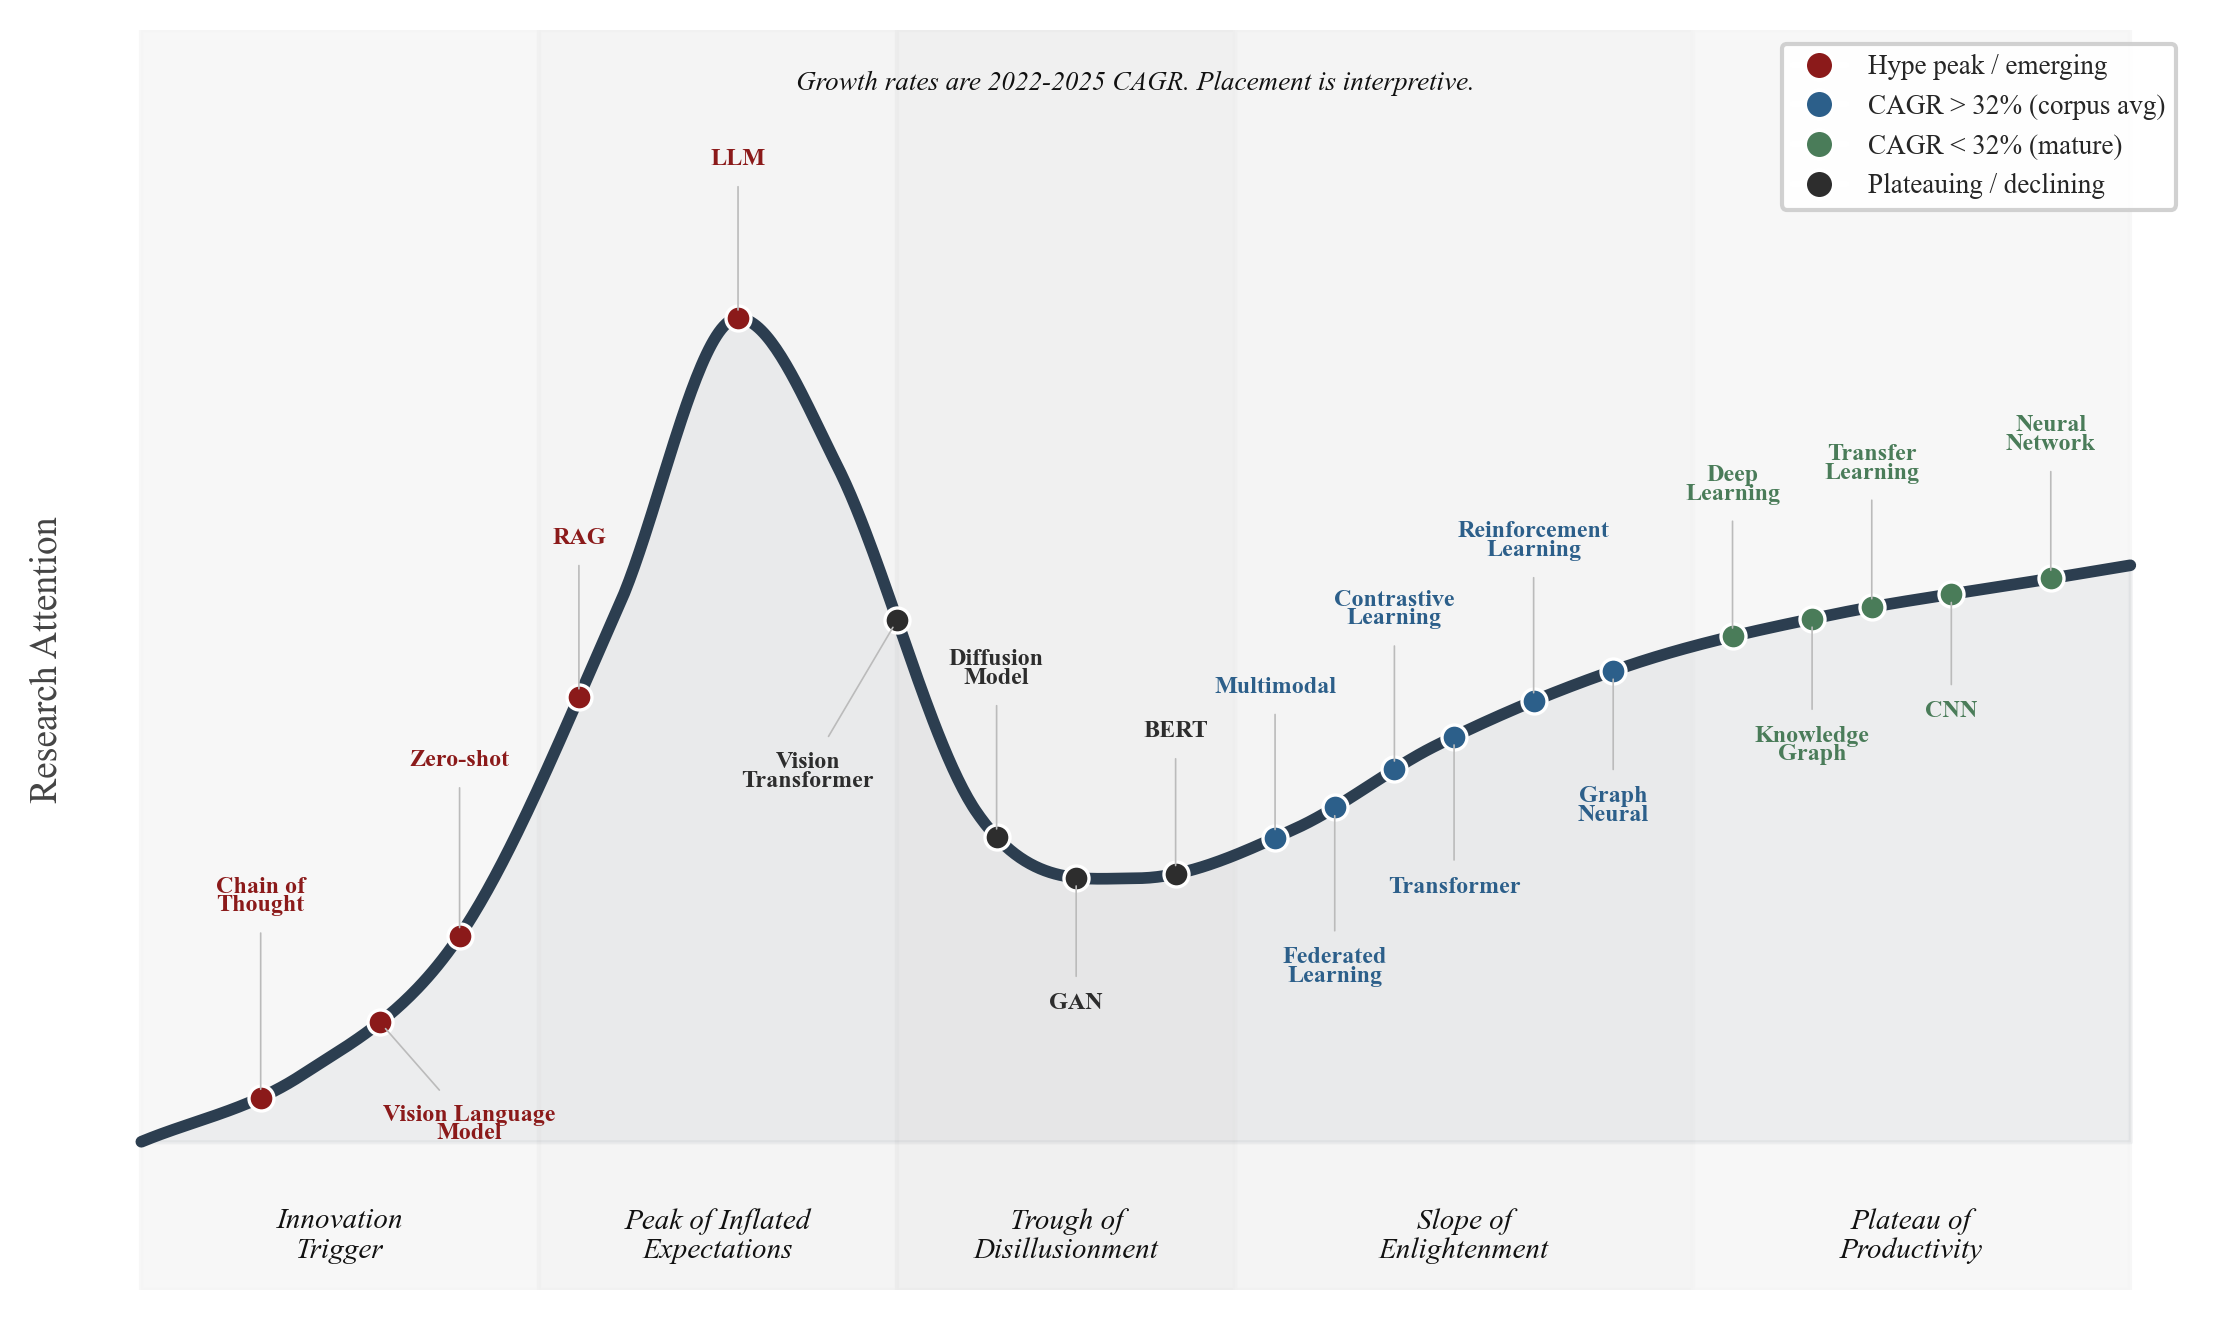
The time-series data places each value at a different lifecycle stage. Using the compound annual growth rate (CAGR) from 2022 to 2025 as the primary metric, with a corpus-wide baseline of 32.0%, we map 20 values onto an interpretive hype cycle.
- Innovation trigger and ascending hype. Chain of thought prompting (64.6% CAGR), coined in 2022, is the newest term. Vision language models (83.9% CAGR, 2,582 to 16,067 papers) and zero-shot learning (68.1%) grew in parallel with LLM adoption. RAG grew from 85 papers in 2022 to 9,329 in 2025 (378.8% CAGR, 110x), and is placed near the peak accordingly.
- Peak of inflated expectations. Large language models have the highest CAGR at 130.4% (7,931 to 96,984 papers). The annualized 2026 estimate (~170,000 papers) suggests continued growth.
- Trough of disillusionment. Vision transformers (60.9% CAGR) still show high growth but have moved from novelty to standard architecture since their 2021 peak. Diffusion models (33.9%) had their breakout in 2022-2023 and are now maturing. GANs (21.8%) and BERT (30.3%) have been largely superseded and sit deeper in the trough.
- Slope of enlightenment. Six values fall in this zone, all above the corpus average: multimodal learning (52.9%), federated learning (52.3%), transformers (48.8%), reinforcement learning (39.2%), contrastive learning (35.8%), and graph neural networks (33.2%). All show steady adoption past their initial growth phase.
- Plateau of productivity. Five values have below-average growth: deep learning (28.3% CAGR, 216,713 papers in 2025), knowledge graphs (25.9%), transfer learning (22.6%), CNNs (16.5%), and neural networks (15.4%). All continue to grow but at or below the corpus rate.
 Tap to enlarge
IV. The Global Research Race
The geographic distribution of AI research has undergone a structural rebalancing. China now leads with 874,019 publications, 21.6% more than the United States (718,676). The crossover occurred in 2021, when China produced 71,273 papers to the US's 64,931, and the gap has widened every year since.
The trajectory is striking. In 2013, the two countries started at near-parity (China with 12,074 and US with 13,829). Both grew steadily through 2018, but diverged sharply after that. US output actually declined slightly between 2021 and 2022 (64,931 to 64,486), while China accelerated. By 2025, the gap stood at 53.4% (187,887 vs. 122,449).
The China-US gap is not uniform across research areas. China leads in six of seven term categories, strongest in "transformer" (2.67x) and "neural network" (1.87x). But the US retains the lead in the fastest-growing category. "Large language model" (47,363 vs. 35,923, or 1.32x). China reached LLM parity with the US only in 2025 (15,008 vs. 14,735).
India
India ranks third globally with 369,931 publications, and its growth trajectory is the steepest of any major producer. Indian AI research output grew 32.3x from 2013 to 2025 (2,761 to 89,287 papers), a higher growth multiple than both China (15.6x) and the US (8.9x). In 2025, India produced more AI papers than Japan (15,558) and the UK (37,104) combined.
Global Research Output by Country (Top 10)
Geographic distribution of AI research publicationsInstitutional concentration is significant. The Chinese Academy of Sciences leads all institutions with 74,921 papers, 49.4% more than CNRS (50,145). Six of the top ten institutions globally are Chinese. Harvard (21,529) is the highest-ranked US institution at position 8.
Paper counts measure volume, not impact. OpenAlex assigns a paper to every co-author country, so China plus the US plus India can exceed 100% of the corpus. Citation-weighted metrics, top-1% shares, and venue prestige can rank the same countries differently. Read these figures as where abstracts are being written, not where the highest-impact work is produced.
V. The Citation Economy
The citation distribution across five million AI papers follows an extreme power law. 48.9% of all papers have received zero citations. Only 2,475 papers (0.05%) have exceeded 1,000 citations. The median paper in this AI corpus has zero citations.
This figure is partly inflated by recency. Papers published in 2024-2026 have had little time to accumulate citations. But the structural pattern is clear. A tiny fraction of papers captures the vast majority of research attention.
Corpus Citation Skewness Distribution
Concentration of academic impact and citationsDistribution Segment Selector
Threshold Cutoff
45 citations
A paper in the 95th percentile of the corpus requires at least 45 citations.
The most-cited paper in this pull is ResNet (He et al., 2015/2016) with 221,202 OpenAlex citations as of 12 June 2026, about 1.9x the next entry. Citation totals move. This is a snapshot. The top-cited papers share a common characteristic. They are reusable building blocks (ResNet, Adam, AlexNet, VGGNet, XGBoost). Infrastructure accumulates citations because every downstream paper that uses the tool cites the original.
- Corpus Analysis, 5,003,783 Papers, 2013-2026"More papers were published in 2025 alone (944,530) than in the first six years combined (2013-2018 at 734,197). The median paper has zero citations."
Open Access Dominance
Of the 5,003,783 papers, 3,043,557 (60.8%) are open access in OpenAlex's tagging. That is more than double the 28% of Crossref-DOI journal articles Piwowar et al. (2018) found were OA across the whole literature. Their 28% is a 2018 snapshot of all fields, not a 2026 AI-specific control. The gap is still large. Preprint culture, anchored by arXiv, is the obvious driver.
VI. Strategic Implications
The aggregation of 5,003,783 research papers yields three core strategic imperatives.
-
The LLM wave is absorbing the rest of the stack. LLMs grew 29.9x in seven years. Every one of the ten fastest-rising research keywords is LLM-related. RAG is the dominant deployment architecture. Organizations without LLM integration have already fallen behind. The strategic question is how to differentiate within an LLM-saturated research and product environment.
-
Volume without impact is noise. With 48.9% of papers receiving zero citations and only 0.05% exceeding 1,000, most of the pile is noise. Teams that can find the 0.05% inside the 944,000 papers published each year, and ignore the rest, have an advantage. The rest of the field is reading the same unread stack.
-
The geography of AI leadership is multipolar. China leads in volume. The US leads in LLMs. India is growing fastest. Six of the top ten institutions are Chinese, but the US retains disproportionate influence in the fastest-growing category. Any strategic assessment that treats "AI leadership" as a single dimension is incomplete. The competition is term-specific, institution-specific, and rapidly shifting.
The query strings, tables, and caveats are in State of AI Research (SSRN 6991218). The live search tool is the AI Reports Library. Counts are the 12 June 2026 OpenAlex pull. They will drift.